Highway traffic
This situational picture provides information about highway traffic in Finland and includes an assessment of its future development. The situational picture of highway traffic is primarily updated twice a year. The information is produced by the Finnish Transport Infrastructure Agency. The information is part of the strategic situational picture of the Finnish transport network.
On this page
- Highway transport performance in 2020
- Traffic volume and forecast
- Heavy-duty transport volume and forecast
Highway transport performance in 2020
In 2020, the highway (78,000 km) transport performance decreased on average by approximately 7% due to the COVID-19 pandemic. The transport performance of passenger vehicles and vans decreased by approximately 7%, of trucks by approximately 2% and of buses by approximately 13% compared to the previous year. The average changes to transport by road classification were different. On class I main roads, traffic performance decreased by approximately 9%, on class II main roads traffic performance decreased by approximately 6% and on regional and connecting roads traffic performance decreased by approximately 3%. The figures only depict average changes, meaning that the changes will be different depending on the month, road and area.
Traffic performance decreased especially in spring 2020, but has largely bounced back after that. Traffic volumes increased significantly in nature travel destinations, whereas airport and border connections saw significant decreases. The largest decrease on average was in south-eastern Finland (-13%) and the smallest in North Ostrobothnia (-4%).
In previous years, the increase in highway traffic performance has been relatively even. The impact of the COVID-19 pandemic on the future changes in traffic performance has not been assessed at this time. The reviews of the strategic situational picture of the highway network, traffic forecasts and the service level on arterial roads are based on primary data from 2019.
Traffic volume and forecast
Traffic volume is illustrated by average daily traffic (KVL) in vehicles per day.
Traffic volume provides an overall image of the significance of the road, the amount of user needs directed at the road and the number of people exposed to the issues on the road amounting to the profitability of the repairs.
Heavy-duty transport volume and forecast
Heavy-duty import transports are increasingly focused on the Helsinki–Turku–Tampere route and export transports also seem to focus on arterial roads. The service level of connections to ports and terminals is also important. The increase in heavy-duty traffic is centralised on arterial roads in southern Finland, in particular.
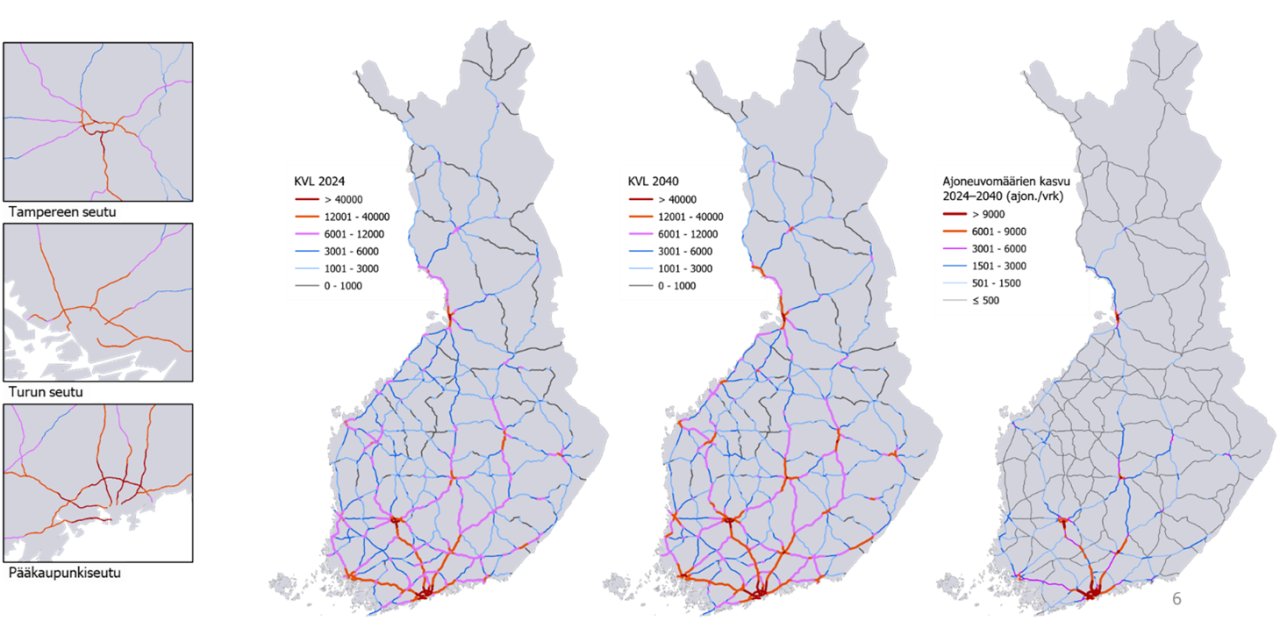
Separate maps of Finland: 1) average daily traffic (KVL) 2019, 2) average daily traffic (KVL) 2030 and 3) increase in the number of vehicles 2017–2030 (vehicles/day).
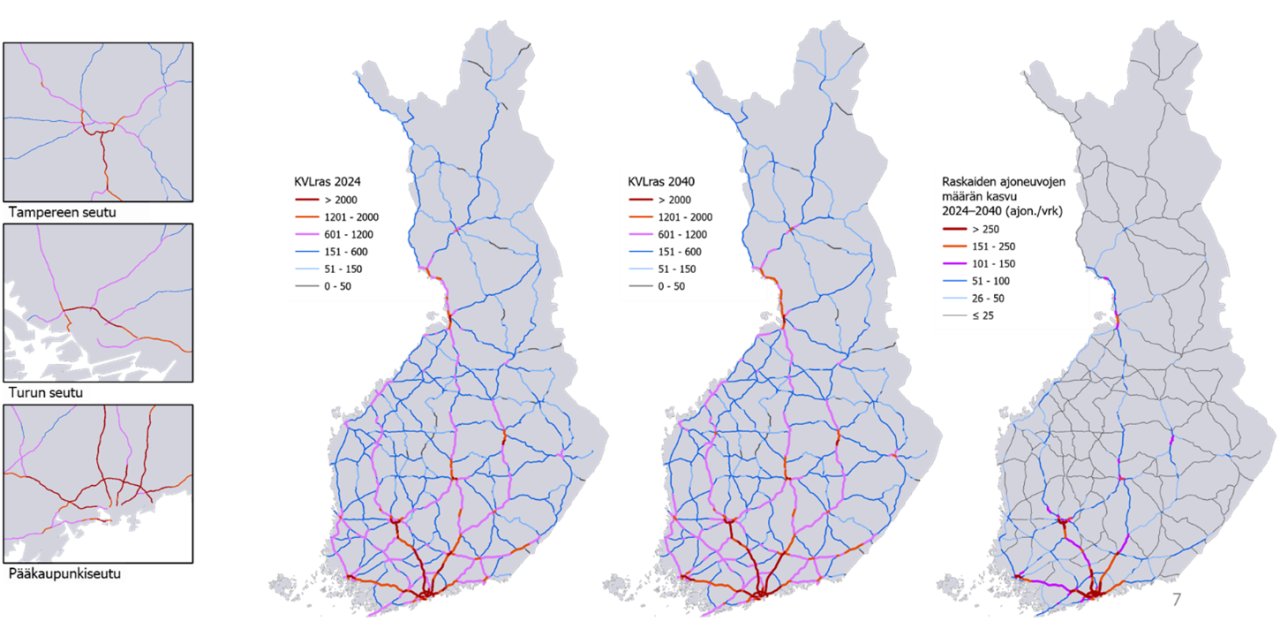
Separate maps of Finland: 1) average daily heavy-duty traffic (KVLras) 2019, 2) average daily heavy-duty traffic (KVLras) 2030 and 3) increase in the number of heavy-duty vehicles 2017–2030.