Availability of taxi services
These statistics provide information on the availability of taxi services. The information is based primarily on data collected from providers of dispatch services (dispatch centres) and taxi companies as part of taxi market monitoring. The statistics are updated annually. The information is produced by the Finnish Transport and Communications Agency Traficom.
On this page
- Interpreting availability
- Regional and temporal examination of the supply of taxi services
- Taxi ordering times
- Explanations
- Downloadable attachments
Interpreting availability
The availability of a service can be defined as the ability of supply to meet demand. The availability of taxi services is examined currently from following perspectives.
1) The number of taxis is a measure of the regional supply of taxi services based on the operating areas of taxis. It provides a more accurate depiction of the actual regional distribution of taxis than licence register data. Taxi-specific operating areas were determined by linking taxi vehicles to the municipalities from which their actual taxi journeys have started or an area consisting of the domicile of the taxi operator, as marked in the register, and neighbouring areas.
2) Ordering time is the average waiting time for a taxi, based on taxi journeys processed via the information systems of providers of dispatch services.
3) The number of taxi journeys in relation to the population provides a comparable measure of taxi journeys by area.
Note: Traficom is renewing its publications on taximarket monitoring. Therefore, not all regular statistical updates have been made in year 2026.
Regional and temporal examination of the supply of taxi services
Before the taxi services reform of 2018, each Finnish taxi had a defined station area, which served as the primary location of the taxi. The obligation of having a defined station area was removed as part of the legislative reform, allowing taxis to move freely between different (operating) areas. The regional distribution of taxis is depicted with the number of taxis, which is based on vehicle-specific operating areas defined on the basis of market monitoring and licence register data. The measure used in the map depicting the change in the number of taxis is taxi density, which means the ratio of the regional population to the number of taxis (population/number of taxis = taxi density). The data behind the map depicting change is grouped by region and the statistical grouping of municipalities. This classification divides the municipalities within each region into three categories based on their degree of urbanisation (urban, semi-urban and rural municipalities).
When assessing the availability of taxis, it should be noted that the taxi market includes both market-driven taxi services and taxi services reimbursed by the public sector, the latter of which are typically carried out as contract journeys. Taxis carrying out contract journeys can also provide market-driven taxi services. The graphs on this page include both market-driven taxi services and contract-based services reimbursed by the public sector insofar as they are represented in the monitoring data.
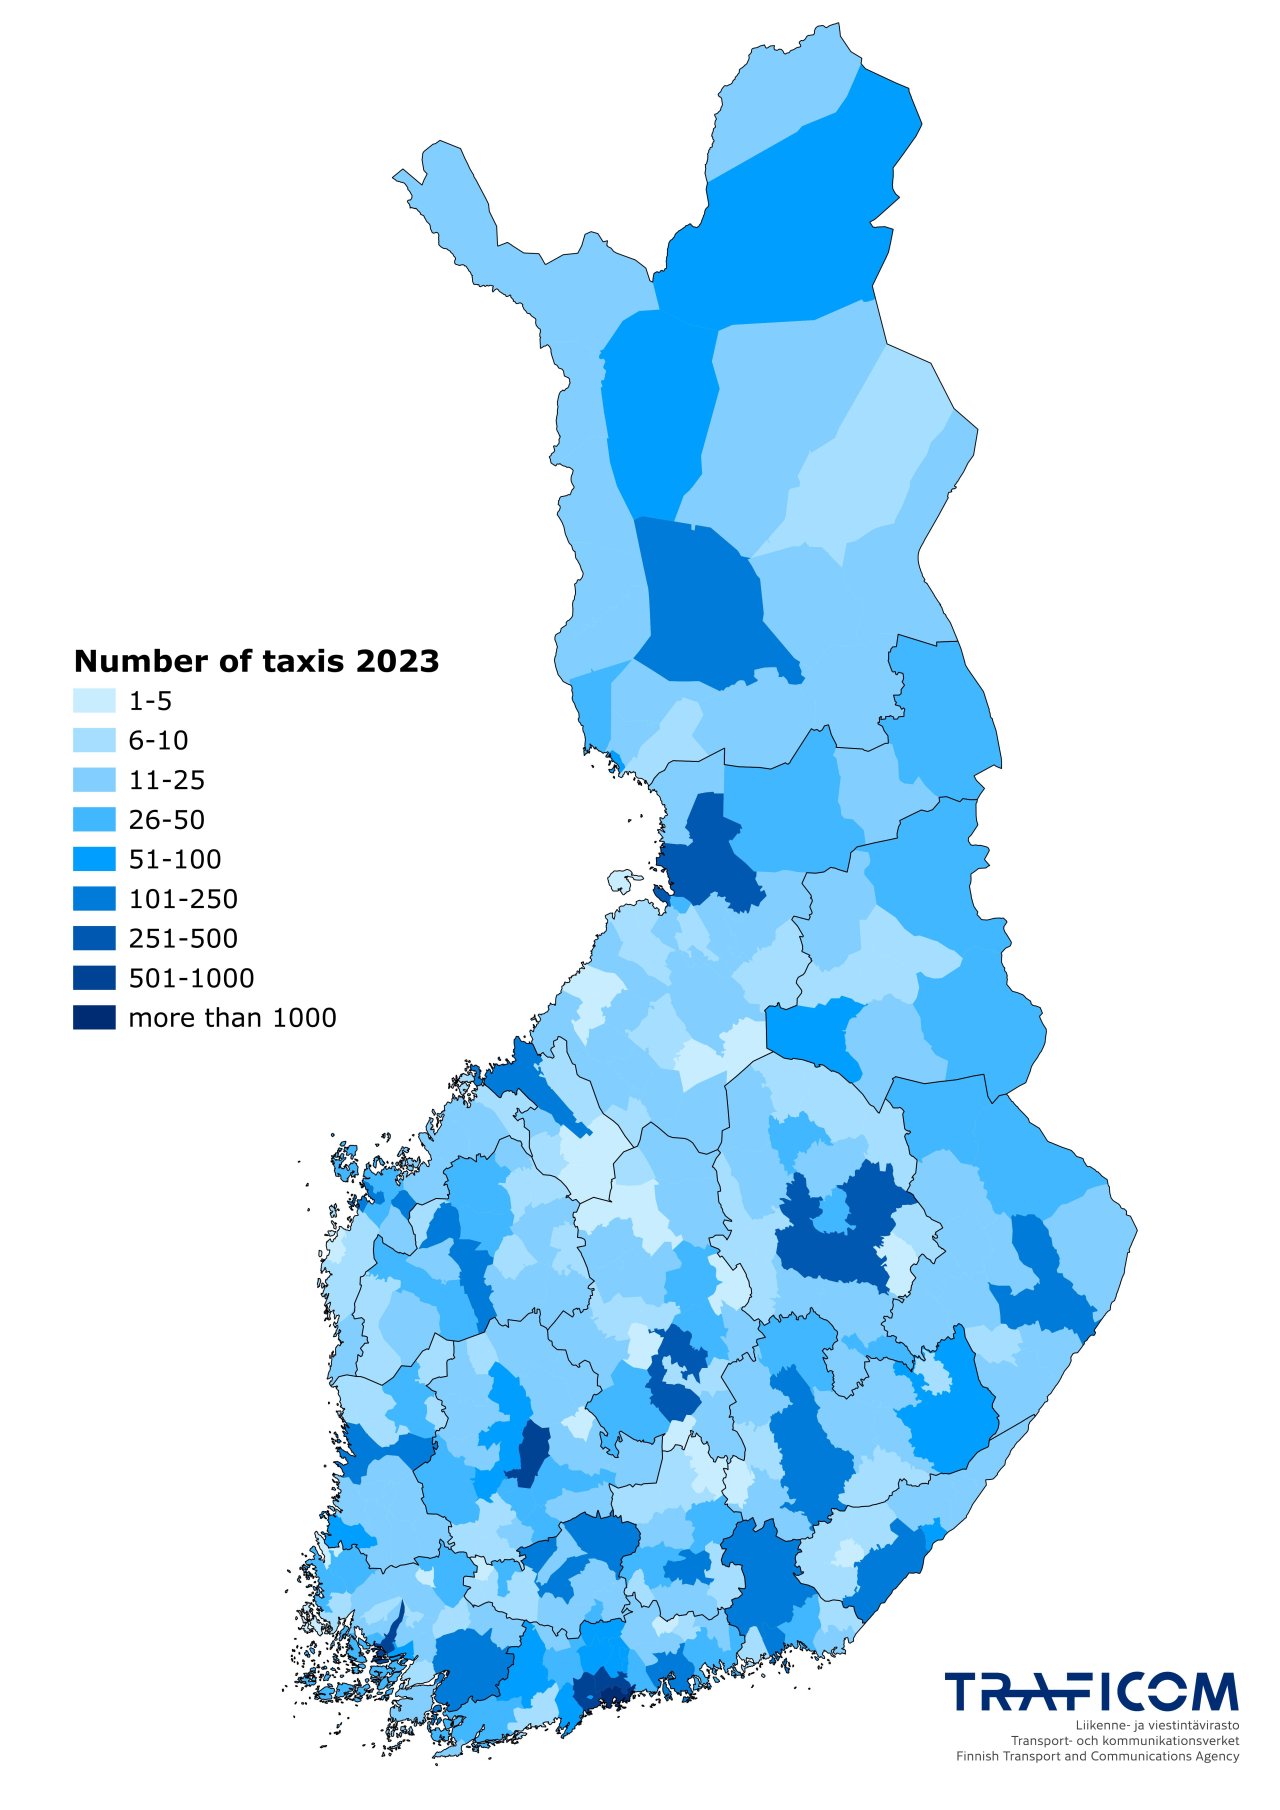
The values shown on the map are the most accurate data available.
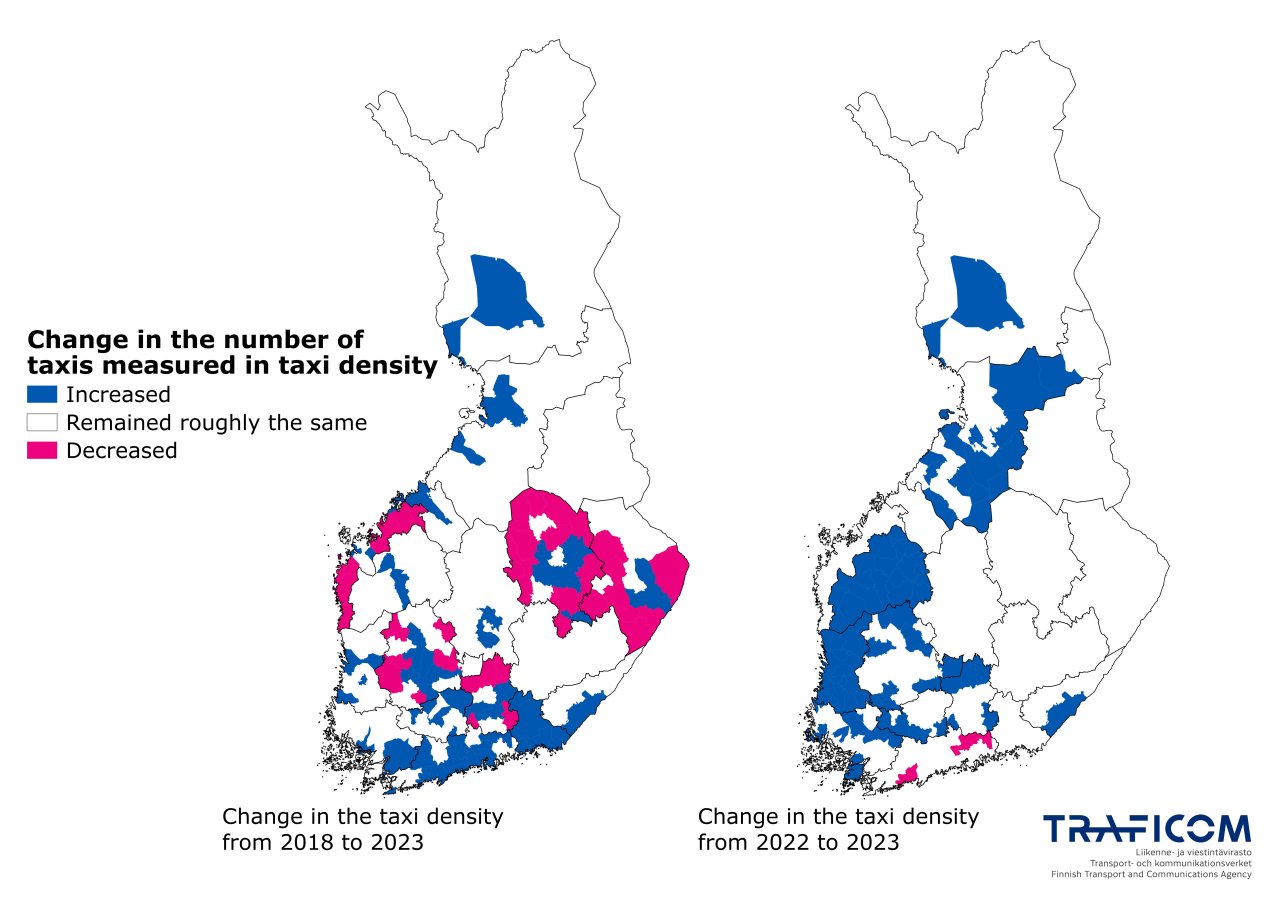
Municipal-specific taxi numbers or taxi densities (population to taxi-ratio) are not available because regional monitoring has been carried out based on the combined grouping of region and statistical grouping of municipalities.
Taxi ordering times
In the scatter plots below, the availability of taxi services is measured using taxi ordering times. Journeys based on advance orders have been excluded from the data. In addition to this, to ensure the quality of the data, only taxi journeys with a realistic calculated average speed and an ordering time of 2–120 minutes are included.
The average ordering time on the graph illustrates the typical ordering time of a taxi journey, while the standard deviation illustrates how similar ordering times typically are. For example, if the average ordering time is 15 minutes and the standard deviation is 5 minutes in a given area, a taxi vehicle will typically arrive within 15 minutes of being ordered, but the arrival time will vary by an average of 5 minutes.
Explanations
The graphs on this page include both market-driven taxi services and contract-based services reimbursed by the public sector insofar as they are represented in the monitoring data. Market-driven taxi services operate without state subsidies, i.e. they are so-called typical taxi services, in which the consumer orders a taxi to travel from point A to point B and pays for the service themselves.
In addition to market-driven taxi services, the Finnish taxi market includes taxi services reimbursed by the public sector. This has typically included travel expense reimbursements paid based on the Act on Disability Services and Assistance and the social welfare act (sosiaalihuoltolaki) (SOTE) or the Basic Education Act (628/1998). Journeys reimbursed by the Social Insurance Institution Kela are often referred to as ‘Kela journeys’ and journeys in accordance with the Act on Disability Services and Assistance and the Social Welfare Act (sosiaalihuoltolaki) reimbursed by the municipality are referred to as ‘SOTE journeys’.
In these statistics, taxi density means the ratio of an area’s population to the number of taxis.
In accordance with the repealed Taxi Services Act (2.3.2007/217), a taxi’s station area means a place or municipality out of which the taxi operates and where the vehicle returns after a journey or assignment. When the Act was in effect, taxis were also obligated to be on call in their station area. As part of the 2018 taxi services reform, the obligation of having a defined station area and being on call was removed, allowing taxi drivers to freely choose their operating areas and times.
An advance order means a timed service that has been ordered to start at least half an hour after the placement of the order.
The statistical grouping of municipalities in accordance with Statistics Finland’s definition:
Urban municipalities are municipalities where at least 90% of the population lives in urban settlements or the largest urban settlement has a population of at least 15,000. In 2022.
Semi-urban municipalities are municipalities where at least 60% but less than 90% of the population lives in urban settlements and the largest urban settlement has a population of at least 4,000 but less than 15,000.
Rural municipalities are municipalities where less than 60% of the population lives in urban settlements and the largest urban settlement has a population of less than 15,000 or municipalities where at least 60% but less than 90% of the population lives in urban settlements and the largest urban settlement has a population of less than 4,000.