This situational picture provides information about the goods and passenger transport volumes of Finland’s ports, their forecast development and the impacts of the COVID-19 pandemic. The situational picture of traffic at ports is primarily updated once a year. The information is produced by the Finnish Transport and Communications Agency Traficom. The information is part of the strategic situational picture of the Finnish transport network.
Goods transport volumes in ports
Foreign sea transport
NATIONAL FOREIGN SEA TRANSPORT IN 2017–2019
Export | 53 | 50 |
Import | 49 | 46 |
Total | 101 | 96 |
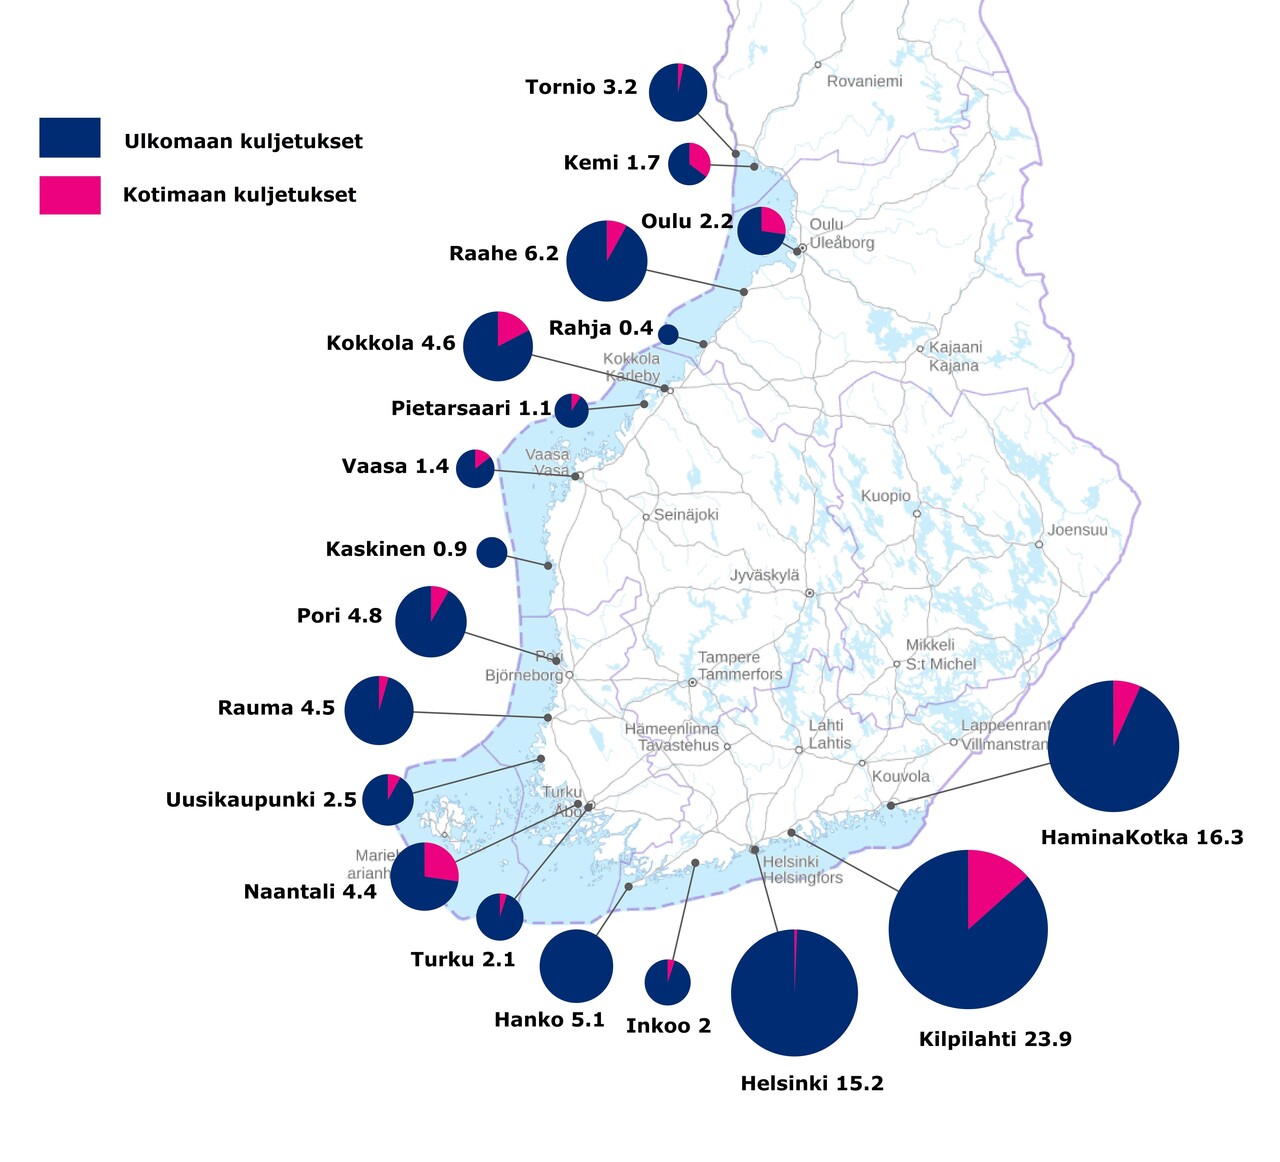
AVERAGE FOREIGN SEA TRANSPORT IN 2017–2019 BY PORT (million tonnes)
Domestic waterborne transport
NATIONAL DOMESTIC WATERBORNE TRANSPORT IN 2017–2019
Export | 7.6 | 7.1 |
Import | 7.6 | 7.1 |
AVERAGE DOMESTIC WATER TRANSPORT IN 2017–2019 BY PORT (million tonnes)
Total goods transport
TOTAL NATIONAL GOODS TRANSPORT IN 2020
Export | 57 |
Import | 53 |
TOTAL GOODS TRANSPORT IN 2020 BY PORT (million tonnes)

Foreign sea transport forecast for 2050 and the change compared to 2017
National transport forecasts (2018) contain an assessment of the growth of foreign sea transport by 2050. The forecasts have been compared to the figures from 2017.
REALISED AND FORECAST VOLUME
Export | 43.7 | 48.4 | 4.6 | 11% |
Import | 45.6 | 48.6 | 3.0 | 7% |
Transit transport | 8.4 | 8.5 | 0.2 | 2% |
Transit transport east | 0.8 | 0.6 | -0.2 | -26% |
Transit transport west | 7.5 | 7.9 | 0.4 | 5% |
Total | 97.7 | 105.5 | 7.8 | 8% |
Passenger traffic between Finland and other countries
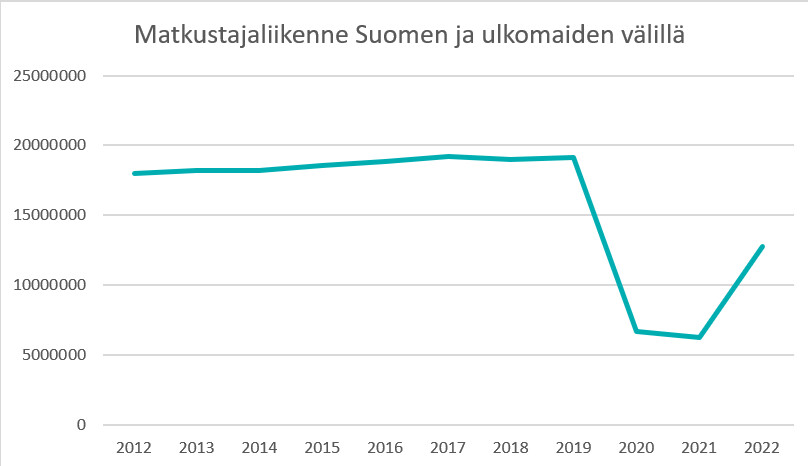
NATIONAL PASSENGER TRAFFIC BETWEEN FINLAND AND OTHER COUNTRIES IN 2017–2019
Total | 19,120,000 |
Passenger arrivals | 9,610,000 |
Passenger departures | 9,510,000 |
Cruise passengers | 1,076,000 |
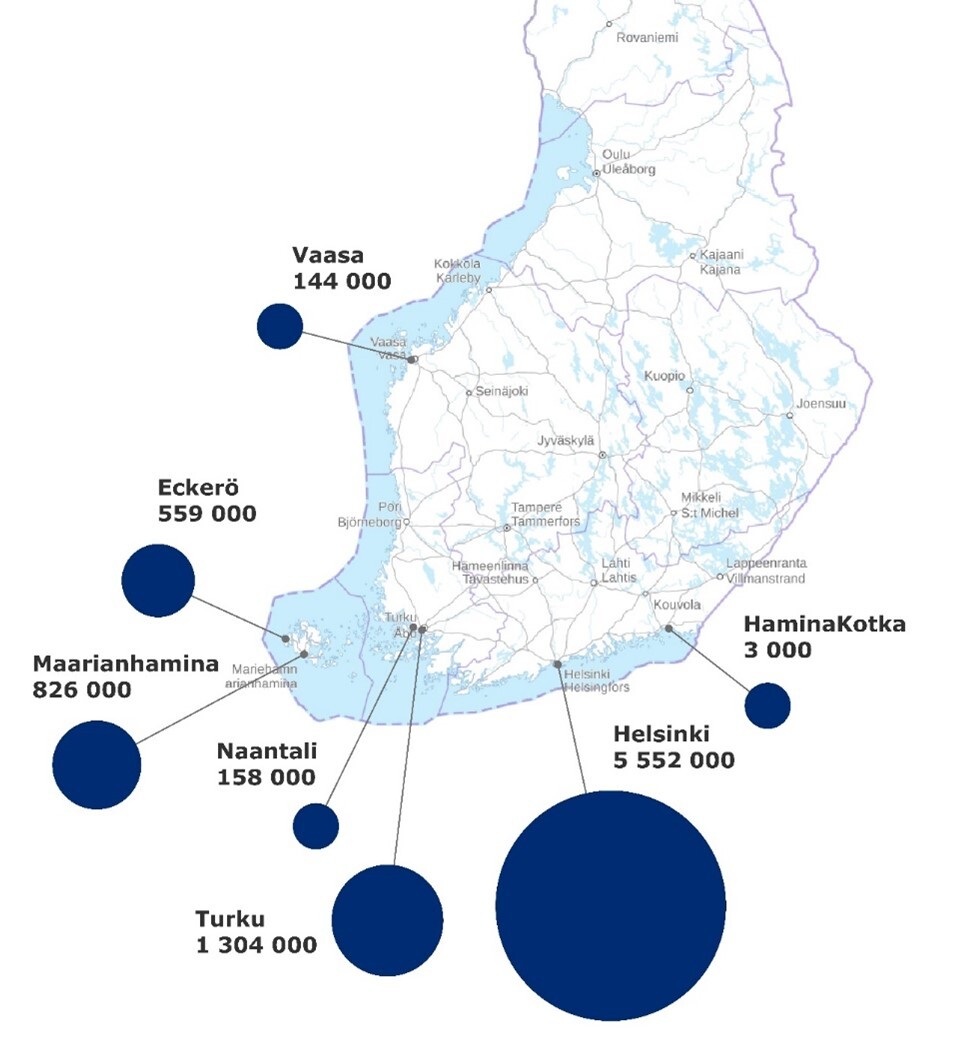
AVERAGE PASSENGER TRAFFIC BETWEEN FINLAND AND OTHER COUNTRIES IN 2017–2019 BY PORT

MATKUSTAJALIIKENNE SUOMEN JA ULKOMAIDEN VÄLILLÄ KESKIMÄÄRIN VUOSINA 2022-2022 SATAMITTAIN

NATIONAL PASSENGER TRAFFIC BETWEEN FINLAND AND OTHER COUNTRIES IN 2020
Total | 6,690,000 |
Passenger arrivals | 3,370,000 |
Passenger departures | 3,320,000 |
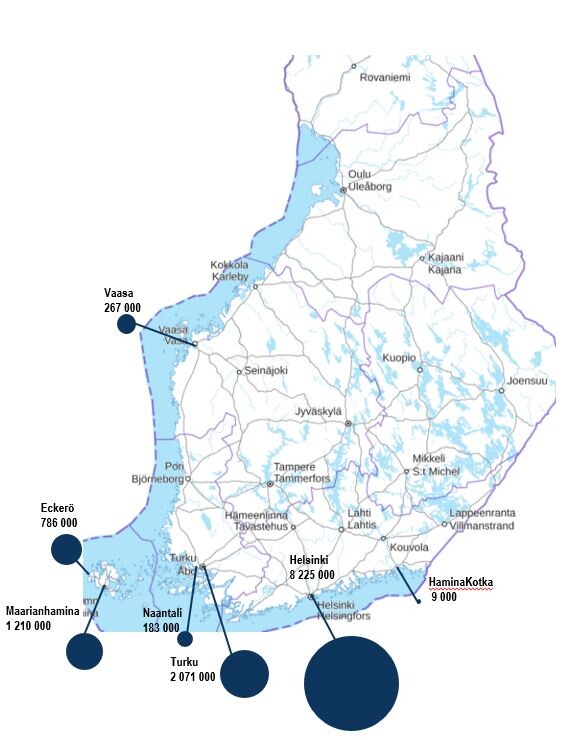
PASSENGER TRAFFIC BETWEEN FINLAND AND OTHER COUNTRIES IN 2020 BY PORT

Statistics Finland data does not contain information on the number of passengers on foreign cruise ships or on the Saimaa Canal in 2020. No national traffic forecasts concerning passenger traffic development are available.
Source: Statistics Finland
Port goods transport volumes – Saimaa ports
During the COVID-19 pandemic in 2020, the goods transport volumes in the most significant ports in Saimaa increased by more than 10% in total. No national traffic forecasts concerning inland waterway traffic development are available. Extending the Saimaa canal locks will create significant development potential in inland waterway traffic.
GOODS TRANSPORT VOLUME BY PORT
Imatra | 480,000 | 540,000 |
Joensuu | 250,000 | 320,000 |
Joutseno | 280,000 | 210,000 |
Kitee | 30,000 | 20,000 |
Kuopio | 70,000 | 100,000 |
Lappeenranta | 510,000 | 540,000 |
Savonlinna | 30,000 | 20,000 |
Siilinjärvi | 160,000 | 200,000 |
Varkaus | 200,000 | 130,000 |